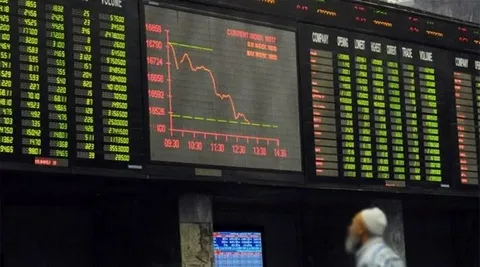
The KSE-100 Index crash of March 9, 2026 sent Pakistan’s benchmark index plummeting 11,015.96 points — a decline of 6.99 per cent from the previous close of 157,496.10 points, dragging the index down to 146,480.14 points by the closing bell. Trading was halted, billions were wiped out, and panic gripped both retail and institutional investors in a single devastating session driven by escalating Middle East war fears and a historic surge in global oil prices. The KSE-100 Index chart, KSE-100 Index return figures, and KSE-100 Index today recovery outlook are all examined in full below.
Background: A Market Already Under Pressure Before the KSE-100 Index Crash
The KSE-100 Index crash of March 9 did not happen in isolation. It is the latest blow to a market that had been bleeding for weeks.
Since the all-time peak on January 23, the index had tumbled by 37,193.83 points — almost 20 per cent — causing a cumulative loss of over Rs4.03 trillion in market capitalisation. The KSE-100 Index return over this six-week period has been devastating for both retail and institutional investors alike.
The first week of March 2026 was already one of the most turbulent in PSX history. On March 2, the market suffered a historic crash of over 16,000 points following reports of military strikes on Iran. While Thursday provided a 5,400-point relief rally, Friday’s decline confirmed the market remained in bearish grip ahead of Monday’s KSE-100 Index crash.
Foreign investors had also been in exit mode, with data showing a net outflow of over $25 million during the week — reflective of global risk-off sentiment, with capital fleeing emerging markets toward safe-haven assets like gold and the US dollar.
Details: What Happened During the KSE-100 Index Crash on March 9, 2026
KSE-100 Index Crash: Market Opens in Freefall
The KSE-100 Index crash began the moment markets opened on Monday. By 10:35am, the index had fallen 11,725.47 points. Trading was first halted around 9:20am when the index dropped 9,780.15 points, triggering a market suspension under Pakistan Stock Exchange regulations. The halt was activated when the KSE-30 index fell 5 per cent from the previous day’s close, suspending all equity-based markets.
When trading resumed, the KSE-100 Index crash deepened further, recording a decline of 13,157.62 points before a brief recovery ahead of the close.
KSE-100 Index Chart: The Day’s Movement
The KSE-100 Index chart showed the benchmark recorded at 147,715.95 at around 9:22am — down 9,780.15 points or 6.21 per cent from the previous close. The KSE-100 Index chart revealed across-the-board selling pressure across key sectors including automobile assemblers, cement, commercial banks, oil and gas exploration companies, oil marketing companies, power generation, and refineries.
KSE-100 Index Crash: Biggest Losers of the Day
The heaviest movers during the KSE-100 Index crash were led by K-Electric Limited, which tumbled 7.81 per cent to Rs7.20 on over 127 million shares. First National Equities Limited plunged 12.21 per cent to Rs1.15, while The Bank of Punjab slumped 10.01 per cent to Rs25.45.
Sector-wise, the KSE-100 Index crash was driven by Commercial Banks (-5,031.81 pts), Fertilizer (-2,192.22 pts), Oil and Gas Exploration Companies (-1,715.57 pts), and Cement (-1,428.11 pts). The heaviest index-point contributors to the KSE-100 Index crash were FFC (-1,595.54 pts), UBL (-1,301.04 pts), ENGROH (-886.37 pts), HUBCO (-718.26 pts), and MEBL (-681.61 pts).
KSE-100 Index Return: How Bad Has It Been?
The KSE-100 Index return figures since January paint a brutal picture. The index has now fallen nearly 19 per cent from its record high of 189,166.83 set in January 2026 — dangerously close to the 20 per cent threshold that formally defines a bear market.
The KSE-100 Index return timeline over the past six weeks:
- January 23, 2026: All-time high of 189,166 points
- March 2, 2026: Historic 16,089-point single-day crash (-9.57%)
- March 6, 2026: Further 3,714-point decline (-2.3%)
- March 9, 2026: KSE-100 Index crash of 11,015 points (-6.99%)
- Total KSE-100 Index return loss in 6 weeks: Over 37,000 points — nearly Rs4.03 trillion in market cap
Monday’s KSE-100 Index crash also marks the highest-ever single-day fall in absolute point terms in PSX history. The largest percentage decline remains June 1, 1998 at 12.4 per cent, but due to the lower base of the index at that time, it does not rank in the top ten for absolute point drops.
Quotes on the KSE-100 Index Crash
Topline Securities said the sharp sell-off during the KSE-100 Index crash was driven by escalating geopolitical tensions globally, triggering widespread risk-off sentiment and heavy selling pressure across the board.
Waqas Ghani, Head of Research at JS Global, told Business Recorder that elevated oil prices are highly detrimental to Pakistan’s external account, and that persistently high commodity prices are likely to trigger a new wave of inflation following the KSE-100 Index crash.
Analysts at Topline Securities highlighted that every $10 increase in oil prices typically adds approximately 0.5 percentage points to Pakistan’s headline inflation — compounding the damage already visible in the KSE-100 Index chart and KSE-100 Index return data.
Impact: What the KSE-100 Index Crash Means for Pakistan
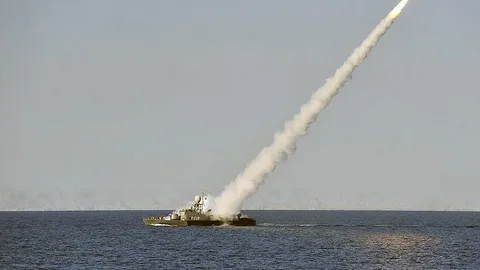
The KSE-100 Index crash comes amid escalating geopolitical tensions and a surge in global oil prices that have weighed heavily on investor sentiment. According to Reuters, oil prices surged around 25 per cent on Monday to their highest since mid-2022, with Brent on track for a record one-day gain.
For an import-dependent economy like Pakistan, rising energy costs translate directly into a wider current account deficit and heightened inflationary pressures. The primary catalysts behind the KSE-100 Index crash were skyrocketing global oil prices and the tightening of shipping lanes in the Strait of Hormuz.
While a drop in global markets was expected following the escalation in Iran, suggestions of foul play have been levelled against large investors at PSX. Most notably, Saudi Arabia’s Tadawul Index dropped just around 2.1 per cent, while other Gulf indices fell under 2 per cent — making the KSE-100 Index crash appear disproportionate by regional comparison.
KSE-100 Index Today: Is Recovery Possible?
The KSE-100 Index today shows early signs of stabilisation. The benchmark surged by over 3,000 points during intraday trading the day after the historic crash, signalling a return of buying momentum. Strong buying activity was observed in major sectors, with index-heavy stocks such as OGDC, POL, PPL, HUBCO, MCB, MEBL, and NBP trading in the green.
However, the KSE-100 Index today recovery remains fragile. Analysts caution that as long as the Middle East conflict continues and oil prices remain elevated, the KSE-100 Index today and in coming sessions may continue to see wild swings. A sustained recovery will depend on the stabilisation of energy prices and the restoration of regional security.
Conclusion
The KSE-100 Index crash of March 9, 2026 is not just a stock market story — it is a story about Pakistan’s vulnerability to external shocks. The KSE-100 Index chart, KSE-100 Index return data, and KSE-100 Index today figures all tell the same story: the index has lost nearly a fifth of its value in just six weeks, and the road to recovery will depend entirely on forces far beyond Karachi’s trading floors. Until the Iran war stabilises and global oil prices cool down, Pakistani investors should brace for continued volatility.